This news page is used to report on any radiation events that this station detects and also to record modifications made to the radiation monitoring hardware/software. If you see an event on the monitor page, please check here to see if I've identified its cause before panicking. If I haven't written anything, please contact me on the address below if you are worried.
You will notice that I frequently refer to radon washout below. This is a common natural phenomenon which is not known to be harmful (in fact, there are arguments that it might even decrease a person's radiation dose). For more information, see the FAQ.
24th November 2025
There was some extremely heavy rain, with large hail stones, in the afternoon. This brought with it a heavy radon washout of about 9% above average. Given the suddenness and ferocity of the rain I'm surprised the washout wasn't even stronger.
15th November 2025
Some less heavy rain. This brought with it a heavier than expected radon washout of 8% above average. I would have assumed that the previous washout would have removed nearly all of the radon there was in the atmosphere, but seemingly there was more.
14th November 2025
Early in the evening there was a severe hailstorm with very heavy rain. This brought with it a massive radon washout of 13% above average.
1st November 2025
At about 3:30pm there was a burst of very intense rain and this caused a radon washout peaking at nearly 8% above background.
28-29th October 2025
There was significant rain in the evening but it started slowly and masked what would have otherwise been a powerful radon washout. Radiation level peaked at about 3.5% above the previous average before dropping to about 4% below average as the soil became saturated.
18th October 2025
It has been dry for sometime now and the background level had crept back up to the long-term average of 0.12 μSv/hr as the soil dried out. There was finally some rain this evening but we only got a fairly light sprinkling which caused a weak radon washout this evening peaking at about 3.5% above background.
23rd July 2025
There was a weak radon washout this evening peaking at about 3.5% above the current background level corresponding to some moderate rain.
7th July 2025
There was a radiation peak of about 4% above the current background level at 4 am. I don't know whether there was any rain at that time, but I think this was likely because the peak has the shape of a radon washout.
21st April 2025
There was a radon washout this evening peaking at about 5% above the current background level. So far this year there has been quite a bit of rain which has kept the soil moist, making radon washouts for the most part too weak to be detected. This time, however, the weather had been dry for about a week and there was a sudden (although not strong) downpour, which are better conditions for a washout.
The overall radiation still remains suppressed and even the peak of the washout even was barely above the long-term average level.
9th Mar 2025
Tropical cyclone Alfred has dumped a lot of rain here over the past couple of days. The rain started slowly and didn't create any noticeable radon washout, but the continuous rainfall has caused a steady drop in radiation level as the soil has become more and more saturated.
Radiation level is now about 6% less than it was prior to the rain.
9th Jan 2025
There was a weak radon washout from 12:00 to 2:00 pm, peaking at about 3% above the current average. The rain was quite heavy at this time and under other conditions would have triggered a much larger washout, but the soil was already saturated from rain the previous night, so there was less radon to wash out.
10th Dec 2024
There was a moderate radon washout from 1:30 to 7:00 pm, peaking at about 5% above the current average. There has been quite a bit of rain about this month, but only occasionally are the conditions right to produce a noticeable washout.
14th Nov 2024
There was another big radon washout from 6:40 to 9:00 pm, peaking at a bit about 8% above average. I'm surprised to see such a large washout so soon after the previous one.
13th Nov 2024
There was a particularly big radon washout from 6:00 to 10:00 pm, peaking at a bit about 9% above average. We are now in the season where we have dry spells followed by heavy rain which produces big radon washouts.
10th Nov 2024
There was a radon washout from 7:30 to 9:30 pm, peaking at a bit under 6% above average. This corresponded to heavy rain.
28th Oct 2024
There was a radon washout this evening, peaking at a bit under 6% above average. This corresponded to some heavy rain.
8th Oct 2024
There were a couple of radon washouts this evening, peaking at a bit over 4% above average. These corresponded to some moderate rain. It's possible they might have been higher had the rain been stronger.
27th Sept 2024
There was a radon washout from 1 to 6 am today, peaking at about 8% above average.
13th Sept 2024
I finally examined Counter 1 to see what was wrong with it. I replaced the Ethernet module, since that seemed to be strongly implicated in the problems I'd seen, and also it turned out that tube 4 had failed. If I'm reading the date code right, the tube was manufactured in July 1982, so that's not unreasonable.
Counter 1 was put back into service at about 5 pm. Since the original problems were intermittent, I can't be certain everything is now fixed, but the only way to tell is to run it and see how it goes.
12th Sept 2024
There was a radon washout from 4 to 6 pm today, peaking at about 5% above average. Unless I've missed something, this was the first significant radon washout so far this year. Counter 1 is still down so the system is less sensitive, but I think the main reason is that it requires it requires specific weather to create a detectable radon washout - a dry period followed by the rapid onset of heavy rain - and these conditions have been rare this year.
28th Sept 2023
There was a thunderstorm starting at about 2 pm which brought a lot of heavy rain and this caused a radon washout peaking at about 6% above average, after which the reading dropped to about 4% below average.
17th August 2023
I still haven't got around to fixing counter 1, so the system is running at reduced accuracy. There was some light rain in the evening today and the system did pick up a radon washout of which peaked at about 3.5% above average. This is a little higher than normal for the very light rain and I think the reduced accuracy of the system might be partly to blame.
10th to 11th May 2023
Over this period, Counter 1 malfunctioned in a major way and was eventually shut down. I still don't have time to fix Counter 1 or remove the erroneous data, but you can rest assured that the alarming increase in rate over this period is not real.
For the record; had this increase been real, it would have been indicative of some unusual event that would warrant serious investigation - it's about twice the magnitude of the strongest radon washout witnessed and the long duration and steady rise are nothing like a radon washout - however the maximum radiation level reached would not in itself have been a dangerous level. The normal background level is higher than this in some parts of the world.
Since Counter 1 was shut down (at 7:06 pm 11th May 2023), this station has been running on Counter 2 alone, which means the accuracy has been reduced from +/- 1.5% to +/- 2.0% at background rate.
13th April 2023
This site currently shows a increase in radiation level between 10 and 11 pm today. This is not a real increase and was caused by Counter 1 malfunctioning. It came good after I cycled power to it, but there is still a problem with tube 4 (again!?) and I think the Ethernet module is failing like it did on the other counter last year. I don't have time to look into this further at the moment. If it plays up again, I might power down Counter 1 until I can fix it.
I intend to purge the erroneous data from the database so that it doesn't mislead people, but I have not done so yet. If you are reading this some time in the future and there is no spurious increase visible, you will know that I've finally got around to doing this.
7th April 2023
There was a radon washout in the evening corresponding to some moderate rain. It peaked at about 3.5% above average.
30th Mar 2023
There was a very big radon washout from about 3 to 6 am. It peaked at about 9.5% above average. There was evidence that there have been rain happening but I wasn't awake at the time, so I don't know how intense it was.
12th Mar 2023
There was some very heavy rainfall in the afternoon which caused a big radon washout of over 6%. Over the previous couple of days there had been some light rain. In the past it has seemed that if a downpour was preceded by light rain, this would reduce the strength of the radon washout - presumably by depleting the radon on the air - but that doesn't seem to have happened this time.
14th Feb 2023
Today there was the classic conditions for a big radon washout; sudden heavy rain after a hot dry spell, and we did indeed see a washout peaking at 6% above average in the afternoon.
24th Jan 2023
There was a small (3%) radon washout caused by some light to moderate rain starting at about 7:30pm.
Since I fixed the issue with Counter 1 it seems that the overall rate increased by about 3 nSv/hr. While it was true that there was warm weather and little rain over this period, and that usually results in an increase in rate as the soil dries out, the jump in rate at the time the counter was fixed happened more quickly than would be expected if it were only soil drying out. It is likely that the problem with the faulty negative connection had been causing all of the tubes to operate at a reduced voltage and this would have reduced the count rate.
17th Jan 2023
There was a power outage from about 1:15 am to 3:45 am this morning and after power was restored Counter 1 Tube 4 started reading low again. This time I decided to bite the bullet and removed the counter to trace the fault. From 1:14 pm to 3:10 pm this counter was out of service. During this period the system was operating at reduced accuracy as it was relying on counter 2 only and this is the main reason why the reading was high during this period (although I think counter 2 reads on average slightly high than counter 1).
It seems the cause was a faulty connection in the common negative to the tubes related to another of those wretched Dupont connectors. They are great for prototyping but I will never use them again in anything that needs to run reliably.
After putting everything back together it seems as if there may now be a bad connection in Counter 1 Tube 6. This is an SI3BG tube which is a high-range tube that only comes into play if the other tubes get overloaded, so I will leave this for the moment. The rest of the tubes seem to be working normally and all readings from 3:10 pm onwards can be considered to be valid.
7th Jan 2023
A small radon washout peaking at 3% above average this afternoon.
I never got around to looking at tube 4. It had a few more hiccups but then came good again.
27th Nov 2022
Another large radon washout peaking at nearly 7% above average this afternoon. The weather at the moment is conducive to large radon washouts; hot and dry periods long enough to dry out the ground so that radon can escape, followed by brief but intense rain to wash it out of the air. Or at least that's how I interpret it.
Meanwhile tube 4 has being playing up again, but I haven't got around to investigating the cause.
21st Nov 2022
Today, tube 4 in counter 1 went wonky for half the day, reading excessively low. It later came good, and I deleted the bad data from the database without doing anything further. I will look into this later if it plays up again.
20th Nov 2022
There was another even bigger radon washout from about 4:30 pm to 6:30 am today. This one peaked at over 8% above average. This was caused by the same conditions as the last one, only the preceding weather was hotter and the downpour particularly sudden.
1st Nov 2022
For the first time in a while there has been a significant radon washout event. This lasted from about 7:30 am to 10:30 am today, and peaked at 6% above average. This counts as a very strong washout, however it was caused by a sudden downpour preceded by about a week of dry and moderately hot weather, so the magnitude is not unreasonable.
8th Oct 2022
There has recently been a problem with Ethernet communications to counter 2. Since about the start of the month it had intermittently not been communicating. Initially, this wasn't too bad because only a few minutes of data per day were being lost, however yesterday it started dropping out for much longer periods of time and it was clear there was a genuine issue.
I ended up replacing the Ethernet module in the counter and this appears to have fixed the problem, although the intermittent nature of the problem means that it's premature to claim victory just yet.
The system has been deliberately designed to cope with problems like this and - except for a short period when I had power off - counter 1 was still providing data and the only effect of this problem was that data logged between 10 am yesterday and 1 pm today will be of slightly reduced accuracy.
18th Sept 2022
Just to let any visitors know that I haven't abandoned updates; it's just that nothing much has been happening for a while. Brisbane is normally very dry over winter, but this year it has been somewhat wet. A wet winter in Brisbane means occasional light rain. The combination of light rain and the soil never seriously drying out have suppressed radon washouts to the point where they are barely detectable. A typical washout happened on 16th Sept 2022, where the level briefly rose to 2.5% above average for a short period around 8 am. This corresponded to rain and was an actual washout event rather than a statistical fluctuation, yet it was only barely statistically significant.
Since my main motivation for reporting washouts is to point out the cause of any sudden rise in radiation levels that might otherwise imply something untoward going on, there didn't seem to be any point in reporting on feeble washouts that were barely even visible.
13th May 2022
Over the past few days there has been quite a bit of rain, but it has built up gradually and hasn't created any noticeable washouts. If you look at the trend over the past week you will see that the radiation level has been continually falling over this period as the ground gets more and more waterlogged. The radiation level is now about 6% lower than the long-term average.
3rd Mar 2022
There was a small radon washout between 4 and 6 am, peaking at about 3% above average.
25-27th Feb 2022
Over these three days there was a lot of rainfall; in fact some areas nearby received a year's worth of rain (over 1 m) over this period and there was extensive flooding. Fortunately, this station is on an elevated location and was not affected by the flooding. Prior to this there had been some relatively light and steady rain which appears to have washed radon out of the atmosphere slowly enough that there was not detectable washout event. So the effect of this large amount of rain was to radiation level considerably. At one point the level got down to 7% below the long term average, although for most of this period it was more like 4-5% below.
18th Feb 2022
From about 5:30 to 7:00 pm there was some light to moderate rain which caused a small radon washout peaking a bit under 3.5% above average.
11th Feb 2022
In the afternoon there was some light rain which caused a barely detectable radon washout (about 2% above average).
3rd Feb 2022
Between 3 and 7 pm there was a radon washout peaking at about 5% above average. This corresponded to some moderate rain.
2nd Feb 2022
Between 2:30 and 5 pm there was a radon washout peaking at about 6% above average. This corresponded to some light to moderate rain. The intensity of the washout is higher than I would have expected; however it has been quite hot for the past couple of days and maybe there was extra radon being released from the soil as it dried out.
16th Jan 2022
Between 3 and 5 am there was a radon washout peaking at about 2.5% above average. This corresponded to rain of unknown intensity (I was asleep at the time). There was been quite a bit of rain since the start of the year, but it was either been light, or built up in intensity gradually and hasn't produced any detectable washouts, and the main effect was to suppress the background level by perhaps 3%
23rd Dec 2021
Early in the afternoon there was a very brief but violent thunderstorm with heavy rain. Normally this would cause a very large washout event, but all that was recorded was a rise in level to about 2% above average - on the borderline of statistical significance. This was very unexpected and I can't fully account for it. There was a lot of water flowing over the ground, so possibly the radon and daughter products were washed away from the vicinity of the counter before they could register.
9th Dec 2021
There was a large washout event peaking at nearly 6% above average from about 7 to 11 PM. This was triggered by a sudden and very strong thunderstorm.
4th Dec 2021
There was a washout event peaking at about 4% above average from about 8 to 10 PM. This was triggered by a moderate amount of rain.
22nd Nov 2021
There was a moderate amount of fairly light rain during the morning. There wasn't any statistically significant washout observed, but the level was suppressed to about 3% below average afterwards.
11th Nov 2021
Radon washout peaking at about 3.5% above average from about 2:30 to 5:30 pm.
8th Nov 2021
Radon washout peaking at about 4% above average from about 1:30 to 5:30 am.
28th-29th Oct 2021
Radon washout peaking at about 3% above average from about 10:30 pm on the 28th to 2:00 am on the 29th.
18th Oct 2021
Radon washout peaking at about 3% above average from about 3:30 to 7:00 pm. This corresponded to some moderate rain. By the way, when I use the word "average" in regard to washouts, I am referring to the average level immediately prior to the washout. In this case, the average had already been suppressed to about 3% below the long-term average, so at its peak this washout in fact just briefly returned the level to normal. Afterwards, the level was further suppressed to nearly 4% below the long-term average.
15th Oct 2021
Radon washout peaking at about 3% above average from about 10:00 to 11:00 am. This corresponded to a very brief but intense shower of rain.
14th Oct 2021
Radon washout peaking at about 4.5% above average from about 3:30 to 9:30 am. This corresponded to some more rain. The level was further suppressed to nearly 3% below the long-term average afterwards.
11th-12th Oct 2021
There was a big radon washout, peaking at 6.5% above average, starting at about 10 pm on the 11th and lasting until about 6 am on the 12th. This corresponded to a significant amount of rain; I don't have a rain gauge but going by the water tank level there would be been over 30 mm. After the washout, the level was suppressed to about 2.5% below the long-term average. There is a bit more rain forecast over the next few days, but when that is over, we can expect the level to creep back up to average as the ground dries out.
1st Oct 2021
Radon washout peaking at nearly 5% above average from about 6 to 9 pm. This corresponded to a thunder storm.
30th Sept 2021
Radon washout peaking at about 3% above average from about 4:30 to 6:30 pm. There was some moderate strength rain at the time. It had been dry for a while and I was expecting a somewhat higher peak than this.
29th Aug 2021
Radon washout peaking at about 3% above average from about 10 pm to midnight. There was the usual brief shower of rain at the time.
24th Aug 2021
There was a radon washout peaking at about 2.5% above average from about 8:30 to 9:40 am today. There was a brief shower of rain at the time.
23rd July 2021
There was a radon washout peaking at about 5% above average from about 8:30 pm to 11 pm today. This was higher than I would have expected for the relatively light rain that was falling at the time.
16th July 2021
There was a radon washout peaking at about 4% above average from about 1 pm to 3 pm today corresponding to a relatively light shower of rain.
15th June 2021
There was a radon washout peaking at about 4% above average from 9:30 am to 11:30 am today. I was not at home at the time but the indications were that there was some moderately heavy rain during this period.
12th May 2021
There was a thunderstorm with moderately heavy rain from about 4:40 to 5:20 pm today, but strangely there was no discernible radon washout. I'm wondering if wind accompanying the thunderstorm might have brought in air which had already been washed of its radon.
5th May 2021
Radon washout from 9:30 am to 1:30 pm corresponding to some moderate rain. This peaked at about 4% above average.
1st May 2021
There has been light and sporadic rain since about midday yesterday. There was no detectable radon washout and instead the rate has been suppressed by a bit over 2% by the wet soil.
17th April 2021
A radon washout peaking at about 5.5% above average occurred between 6:30 and 8:30 pm, corresponding to some moderately heavy rain.
22nd March 2021
There has been quite a bit of rain over the past week and some of it fairly heavy, but it started slowly and steadily enough that it didn't cause any detectable radon washouts. Currently, the radiation level is very much suppressed due to the wet ground; possibly as much as 8% below what would be expected in dry conditions. The rain is predicted to hold up for another couple of days, so it will be interesting to see how far the level falls.
15th March 2021
A weak radon washout from a fraction before midnight to about 2:00 am, peaking 3% above average. There has been mostly light intermittent rain around at the moment.
9th March 2021
Radon washout from about 4:00 to 7:00 am, peaking about 4% above average. Not sure how heavy the rain was at this time.
2nd March 2021
At about 5:30 pm a big storm with very heavy rain came over and I was expecting a massive radon washout, but soon after the rain started a tree branch fell onto the power lines outside the house and the power went off. There were lines down all over the city and it took over 5 hours before power was restored, so this station completely missed the washout. :(
For the record, power was out from 5:39 pm to 10:52 pm.
The Geiger counters run off 12 VDC and could be kept running during a blackout with a battery, but the server would need a UPS and a small off-the-shelf UPS is not going to hold up for five hours.
23rd February 2021
A radon washout from 7:00 to 10:00 pm, peaking at a bit under 4% above average corresponding to a short but intense burst of rain. About 5 minutes worth of data was lost due to a power outage caused by lightning, but this isn't enough to affect the readings. Fortunately, the server and Geiger counters all started up correctly after the outage without manual intervention.
14th February 2021
An unremarkable radon washout from about 6:00 to 9:00 am, peaking at about 3.5% above average.
18th January 2021
A relatively mild radon washout from about 5:30 to 7:30 pm, peaking at about 3% above average. This corresponded to a moderate intensity shower.
17th January 2021
Display of the radiation trend has now been sped up. Now you should see it as soon as the page loads rather than having to wait several seconds for it to appear. Historical data is also much faster to view. This speedup was achieved by adding an index to the database table and changing the way I did SQL queries.
16th January 2021
A very big radon washout occurred from about 7:00-9:30 pm peaking at a bit over 10% above average. There had been over a week of dry weather followed by a sudden and extremely heavy downpour, which are perfect conditions for a big washout.
6th January 2021
Radon washout from about 8-10 pm peaking about 4.5% above average. It had been dry for long enough that a relatively moderate rain shower was enough to create a detectable washout event.
15th December 2020
I have changed some of the SSL settings for this site to improve security. This has included removing some weak ciphers and adding an intermediate certificate. The latter was to placate some browsers which were (incorrectly) complaining about the certificate not being issued by a trusted authority.
The site now rates A on the SSL Labs Server Test
The main visible effect of this is that if you have been viewing this site using HTTPS (i.e. using the link https://possum.tv/rad_mon.html instead of http://possum.tv/rad_mon.html) and been getting a scary (but bogus) warning from your browser claiming that this site was "untrustworthy" — which I think was the case with at least some Android phones — this warning should now no longer be present.
It's also possible that if you are viewing this site using HTTPS with a very old browser, it might no longer be able to connect. If you are having any problems please let me know by email.
13th December 2020
Today there has been some heavy rain which hasn't registered any sort of washout event on the counters at all; instead, the readings have gone down by about 4% due to the soil becoming soaked. What has happened is that it started raining two days ago, but at that point the rain was light and intermittent and only gradually became heavier over time. I think this light rain washed the radon daughters out of the air slowly enough that they were decaying away faster than they were being washed out, leading to no detectable increase in radiation level. Currently the ongoing rain is washing the radon out as quickly as it's being formed and the rain will need to hold off for a few days before the radon builds up enough that a detectable washout can occur.
7th December 2020
There was a radon washout peaking at 9% above average (which counts as very high based on what I've seen so far) from 2:30 to 5:30 pm today. This corresponded to some fairly heavy rain after a considerable hot, dry spell. There was some water runoff from the garden near the counters which might have boosted the level.
17th November 2020
There was a radon washout peaking at 4% above average from 2:00 to 4:30 pm today. This is a bit higher than I would have expected for the relatively small amount of rain which fell at this time, however the temperature had been quite warm for a few days prior to this and possibly there was a little more radon emerging from the soil as it dried out.
11th November 2020
At about 3 pm today I swapped over the server from my old cable Internet service to the new NBN service, which uses the same physical cable but is more expensive and gives me half the speed. :( I was forced into this because my land-line phone has degraded to the point where it no longer works and will be disconnected entirely next year. To get a working land-line, I need to switch to the NBN, where the phone works over VoIP.
There would have been an interruption while I was changing the modems over and while the new IP address was propagating, but everything should have been back to normal by 4 pm. It is possible there may be a few short outages over the next few days if I have to reconfigure something. This will not affect the data logging.
31st October 2020
There were severe storms over most of the Brisbane area today, including hailstones up to 140 mm diameter. However the local area missed out on virtually all of this; there was a slight drizzle in the afternoon which did not create a statistically significant radon washout.
28th October 2020
There was a radon washout peaking a little under 5% above average from 3:00 to 5:00 pm today, followed by a second washout of 5% from 8:00 to 11:30 pm. These corresponded to a thunderstorm followed by considerable rain. The magnitude of these washouts is normal considering the relatively heavy rain that has been falling.
27th October 2020
There was a radon washout peaking a little over 5% above average from 3:00 to 6:30 pm today. This corresponded to a thunderstorm.
25th October 2020
There was a radon washout peaking a little over 3% above average from 2:00 to 4:00 pm today, after which the background level was reduced by 1-2%. I think around 15 mm of rain fell over the day. During this washout, power went out briefly due to lightning, but the server and Geiger counters restarted quickly and only three minutes of data was lost.
24th October 2020
There was a fairly strong radon washout peaking at nearly 6% above average from about 12:30 to 6:00 pm this afternoon, corresponding to moderately heavy rain. There was no overflow from the water tank interfering with the readings, but there might have been runoff from elsewhere in the garden. I suppose it's a question whether this should be considered legitimate: if the rainfall exceeds a threshold where it causes runoff it will boost the detected radiation level beyond what would be expected for a given radon content. This threshold is unique to this particular site and it arguably gives a misleading impression of what's going on in general. On the other hand, the detected radiation level is likely to be affected by local conditions wherever the counters are situated, and in the absence of any official standards, one location is arguably as good as another.
22nd October 2020
There was a radon washout peaking at nearly 4% above average from about 12:30 to 2:30 pm this afternoon. There was rain at the time, but it was not particularly intense and it turns out the water tank inlet strainer was overflowing and this was would have been boosting the level somewhat. BTW, this strainer consists of fine (I think 1/2 mm) stainless mesh and is intended to keep mosquitoes out of the tank, but it seems to also trap silt, which then hardens to a concrete-like consistency during dry weather, blocking the tank inlet. Unfortunately, water overflowing from this inlet runs directly under the Geiger counters, and this water, which contains fresh radon daughters, boosts the count higher than would be normal for the amount of rain.
In theory, this strainer shouldn't see any silt as there are an additional two strainers and a first flush diverter prior to it, but somehow enough enough has been getting through to cause a problem. In future I will periodically check this strainer and clean it as needed. Quite apart from interfering with the Geiger counters, this is also losing me rainwater.
19th October 2020
There was a radon washout peaking at nearly 4% above average from about 1:30 to 4:30 am this morning. There was rain at the time but I did not observe its intensity and duration, but the overall quantity must have been low because there was no change in the water level of the rainwater tank.
15th August 2020
This site now uses a properly signed SSL certificate from Letsencrypt, so now you can access it using https (i.e. https://possum.tv/rad_mon.html) without browsers (arguably wrongly) claiming that it's insecure because it uses a self-signed certificate.
I should have set this up some time ago, but it took me a while to work out a way to use Letsencrypt without having to run a client with root privileges.
Also, there were a couple of bursts of very light rain today which produced a couple of very weak radon washouts.
18th July 2020
Just a mention that the FAQ page has been updated. No major changes, but bringing some things up to date and pruning dead links.
The forecast rain referred to below was lighter and less in quantity than expected. There was perhaps a tiny, but not statistically significant, washout on the 8th July, but the only really visible effect was a sight drop in level over the period 9th to 10th July.
6th July 2020
The cable Internet was down from 9:47 am to 10:17 pm today, but this won't affect any historical data on this site. Some rain is forecast for later in the week, so we might expect a radon washout or two if it's heavy enough.
14th June 2020
There was a radon washout from about 1 pm to 3 pm, peaking at about 3% above average corresponding to some moderately heavy rain.
21st May 2020
There was a radon washout from about 3 pm to 6 pm, peaking at about 4% above average. I did not record the intensity of rain at this time but I believe it was moderate. There was also some lighter rain around this time which did not register.
19th Apr 2020
After several dry weeks there was a brief shower of rain. The rain wasn't very heavy or prolonged, but there was a significant radon washout, peaking at about 4.5% above average, from 11 am to about 1 pm.
As well as acting as a rain gauge, the Geiger counter is also acting as soil moisture gauge. Over the past weeks, the background rate crept up from the abnormally low level of 0.116 μSv/h to a more normal 0.120 μSv/h as the soil in the garden dried out.
6th Mar 2020
From 6 to 7 pm there was a radon washout peaking at a bit under 4% above average. The magnitude of the washout was smaller than I would have expected given the very heavy rain that fell, and I think the reason is that radon levels have been suppressed by the ongoing wet weather.
10th Feb 2020
From 7:30 pm to about 10:30 pm there was a radon washout peaking at 3% above average. Owing to continuing wet conditions, the average is perhaps 4% less than it was when it was dry.
6th Feb 2020
There has been ongoing rain, but this hasn't been causing washouts because it hasn't been dry for long enough for the radon the start accumulating. Instead, the soil is steadily becoming more saturated and this is reducing the radiation level. Today's readings show this happening particularly strongly, with the level being reduced to nearly 6% less than what would be expected under dry conditions.
4th Feb 2020
From midnight to about 3 am there was a radon washout peaking at 6% above average.
18th Jan 2020
Yesterday evening there was some rain. Although we probably had over an inch of rain in total, it started of gently and ramped up over time, meaning we didn't get a detectable radon washout. After about 11 pm last night, the wet ground suppressed the radiation level by about 3%.
11th Jan 2020
Radon washout from about 7:30 to 11:00 pm, peaking at about 4% above average.
24th Dec 2019
There was a fairly strong downpour of rain which resulted in a radon washout occurring from 8 pm tonight until about 1 am the following day. The peak level was nearly 7.5% above average. The washout appeared to have two peaks, one at around 8:30 pm and a second larger one at a bit after 11 pm. I was not monitoring the rainfall closely enough to determine whether these peaks corresponded to peaks in the rainfall rate.
22th Dec 2019
There is now smoke from the bushfires starting to affect this area and it's set me wondering what the radiological effects of this might be.
By way of explanation:
Radon is constantly being emitted from the earth's crust due to decay of radium. Radon itself and its first few daughter products (which my Geiger counter picks up) decay away quickly, such that they are virtually gone after a few days. However, they don't immediately decay to stable lead, but end up as radioactive lead-210. This has a half life of 22 years and tends to accumulate in the environment. Lead-210 in turn decays to bismuth-210 (half life 5 days), polonium-210 (half life 138 days) and finally to stable lead-206.
Consequently, soil and plants can accumulate Pb-210, which is continually producing Bi-210 and Po-210. Neither Pb-210 nor Bi-210 are exactly good for you, but Po-210 is really bad news. If polonium-210 sounds familiar, you might be remembering KGB agent Alexander Litvinenko who was assassinated using this substance. Po-210 is a strong alpha emitter. It has almost no gamma emissions and is safe outside the body, but ingested or breathed in, it's really bad news.
Fortunately Pb-210 only accumulates up to a certain maximum level (known as the equilibrium concentration) and this in turns limits the amount of Po-210 in the environment. The level is extremely low and consuming ordinary food constitutes no radiological hazard. However the equation changes if the Po-210 gets concentrated by some mechanism. Apparently Po-210 on tobacco leaves causes a significant radiation dose to smokers and is likely to be at least partly responsible for lung cancer deaths.
So now we have large amounts of plant matter being burnt and the resultant ash and soot being deposited elsewhere.
It would be interesting to know how much Po-210 is being mobilised this way. I think it's unlikely to be a significant hazard compared to the fine particulate matter and toxic chemicals in the smoke, yet it's worth looking at.
Unfortunately, my Geiger counters are not useful for this purpose. None of the three radioisotopes involved have much in the way of gamma emissions. Maybe some of the beta emissions of Bi-210 could be detected, but this would be a very small effect and probably undetectable above random background variations. To do this right you would probably need an alpha spectrometer, which is way beyond my resources.
16th Dec 2019
There was an anomalous drop in readings between 12:30 and 2:00 pm today. On checking the raw data I found that the problem was confined to Counter 1 and was consistent with the power supply voltage dropping off and then recovering. Today was a particularly hot day, and this happened when the temperature was at its maximum — the nearby Possum Box 4 registered over 42°C for most of this period.
I have purged most of the anomalous data from the database to avoid confusion.
13th Dec 2019
From about 4:00 to 5:30 pm there was a radon washout peaking at about 2.5% about average. This corresponded to a short but fierce rainstorm. This is a much lower increase than last time and I think is probably because the radon has not had much time to build up since then.
11th Dec 2019
From about 11 pm until about 1 am the following morning there was a radon washout peaking at nearly 7% about average. This corresponded to a fierce rainstorm. After the rain, the level had dropped to perhaps 2% below average. This will gradually rise over time as the ground dries out. This a classic radon washout event.
1st Dec 2019
From about 2 to 5 pm there was a radon washout peaking at about 4% above average and corresponding to a brief shower of rain. I am not sure how intense the shower was because I was out of the house at the time. There had been no rain since mid November, so there should have been a greater than normal build-up of radon and daughter products, but the radiation level was not detectably elevated. This is what would be expected from theory; radon itself and daughter products Pb-214 and Bi-214 have short half-lives and would reach an equilibrium concentration within a few days, whereas the production of further daughter products would be bottle-necked by the long half-life (22 years) of Pb-210.
24th Nov 2019
At a few minutes past 8 pm there was a drop in radiation level to about 2.5% below average. This was caused by water overflowing from a drain dampening the very dry soil below the Geiger counter. This is interesting. I have noticed before that wet soil reduces the level, and one theory was that it was suppressing radon gas escaping from the soil. In the present case the drop in radiation was so sudden that I think this theory can be ruled out. The water is either washing radon daughters away from the vicinity of the counter or shielding against radiation coming from the soil itself.
17th Nov 2019
Today from 1:00-3:00 pm there was a radon washout peaking at about 5% above average. This corresponded to a very brief but heavy shower of rain, which also brought some hail with it. The actual amount of rain that fell would have been no more than 1 mm - I really need to get a rain gauge.
18th Oct 2019
Today from 12:00-1:00 pm there was a radon washout peaking at about 6% above average. This corresponded to another brief but heavy shower of rain. It might sound like we're getting a lot of rain recently, but mostly it's been only 1 mm or so at a time and way less than is normal for this time of year.
17th Oct 2019
Today from 5:00-6:00 pm there was a radon washout peaking at about 5% above average. This corresponded to a very brief but fairly heavy shower of rain.
15th Oct 2019
Today from 2:00 am to about 5:30 am there was a radon washout peaking at nearly 7% above average. Some rain fell around this time but I was asleep and don't know how heavy it was. The actual amount of rain that fell can't have been much because there was no change in the water tank level. Interestingly, quite a bit of rain (possibly 20 mm) had fallen a few days prior to this without anything registering on the counters. My theory is that there is a threshold of rain intensity below which a radon washout won't register - the radon daughter products are decaying away faster than they are being washed out of the air.
17th Sept 2019
Today from 5:30 pm to 7:30 pm there was a radon washout peaking at nearly 7% above average. This corresponded to the first rain we have had in a couple of months. The rain was not particularly heavy and I think the comparatively high level was due to a lot of dust being washed out of the air.
23rd July 2019
Today from about midday to 1 pm there was a statistically significant bump in the radiation level, peaking at 3% above average. The magnitude and duration of this are somewhat similar to a radon washout, but there was no rain at the time. An obvious suspect was the problem with tube 2 on counter 1 (that I thought I had fixed a few days ago), but on checking the database there was no problem with any of the tubes.
So I'm not sure what was going on with this. It seems real yet it wasn't associated with rain, nor was there any abnormal solar activity (See SpaceWeatherLive). I don't see anything to be worried about at this stage; it was a very small and short-lived event and the background level returned to normal afterwards.
20th July 2019
There had been some more intermittent problems with tube 2 of counter 1 and today I decided to get to the bottom of it. I removed counter 1 from service and redid all of the wiring between the front and rear boards, this time soldering the wires at both ends rather than using DuPont connectors. DuPont connectors are cheap and commonly used for prototyping systems, and they work well enough where there are a gang of connectors used together, but I had used them singly in order to increase electrical isolation and reduce capacitive coupling between the tubes and they don't hold securely enough when used this way.
This didn't fix the problem (although was worth doing for its own sake), and further inspection of the board found a dry solder joint in the tube 2 circuit. Re-soldering this seemed to do the trick.
With intermittent problems it's difficult to know whether you've really fixed them, but in this case it's more likely than not that I have. Counter 1 was out of service for most of the period from 1:40 pm to 3:40 pm today and there will be reduced accuracy for this period, but you probably won't notice any difference of the graph because not much was happening around this time.
16th June 2019
Radon washout peaking at about 8% above average from about 3:30 pm to 5:45 pm. This corresponded to the onset of rain.
5th June 2019
From about midday until 11 pm tube 2 of counter 1 started to play up again. This data has now been purged from the database.
2nd-3rd June 2019
Between about 8 pm on the 2nd and 9 am on the 3rd , comms to counter 2 failed a total of six times. This time, however, the counter restarted as intended. Soon after that — between about 10:30 to 11:30 am on the 3rd — tube 2 of counter 1 started playing up, giving bursts of spurious counts.
I have purged the spurious counts from the database so as not to give a misleading impression of what was happening. I am glad that the system logs all ten tubes separately — if one tube is going crazy and the other nine are behaving normally, I can be sure that the one tube is at fault, whereas a system with a single high sensitivity pancake tube, or with multiple tubes in parallel, would simply register a change in level with nothing to indicate whether it was real or not.
I was not present at the time and I am not sure exactly what happened to trigger all of this, but there was probably some storm activity around.
25th May 2019
There was an (initially) unexplained drop in radiation level of nearly 4% from 6 to 8 am today. The only unusual thing that had been happening was that a brush turkey had been raking leaves for his nest past the counters.
On further investigation, it appears that tube 2 of counter 1 was giving anomalously low readings, and when these readings were purged from the data, the radiation level for this period was normal.
20th May 2019
There have been some problems with the counters locking up, and as luck would have it I was away from home and unable to do anything about them for a while. Today, I did some testing and loaded some new software to them which I hope will improve matters.
Although it is not a primary cause of the problem (which is still unknown), a big contributing factor is the software changes I made in November 2017. I had configured each counter to use the hardware watchdog timer in the CPU to restart it if the software locked up, and in addition the software would manually trigger a watchdog restart if communications dropped out for more than 15 minutes. This was theoretically a bulletproof method of automatically recovering from virtually any recoverable problem - except for one thing: there was a bug in the Arduino bootloader which cause it go into an infinite reboot loop whenever a watchdog timeout was triggered. So rather than allowing the counter to recover after a problem, it instead guaranteed that it would never recover, until such time as someone was able to power-cycle the counter.
Anyway, today I did some tests which proved that this was in fact the problem, and I then programmed both counters with new bootloaders and verified that they would in fact recover correctly after a watchdog timeout.
So the primary problem which was initially causing the counters to fail is still there (and clearly hasn't been fixed by the Ethernet surge arresters I installed in March this year), but at least we have a better chance of them restarting automatically after such a failure.
Here is a record of what counters were down and when. If you look back at the graphs, you will see some apparent slight rises and falls in radiation level during the periods of time when the system was operating at reduced accuracy (in particular a rise in the afternoon of the 8th May) - these are not real and can be ignored.
| Time and Date | Event |
|---|---|
| 8th May 2019 - 11:08 am | Counter 1 down; accuracy reduced |
| 8th May 2019 - 4:17 pm | Counter 2 down; all logging stopped |
| 11th May 2019 - 7:34 pm | Both counters restarted, logging resumed |
| 13th May 2019 - 4:52 pm | Counter 1 down; accuracy reduced |
| 14th May 2019 - 8:55 pm | Counter 2 down; all logging stopped |
| 17th May 2019 - 10:44 pm | Both counters restarted, logging resumed |
| 20th May 2019 - 12:39 pm | Started working on counters, accuracy reduced |
| 20th May 2019 - 2:34 pm | Both counters back in service, full accuracy restored |
4th May 2019
From about the 19th to the 27th of April, there was a significant drop in radiation level. This corresponded to light rain falling over an extended period. Today there was a slight washout from approx 1 to 4 pm, peaking at 3% above average, corresponding to some slightly heavier rain. So nothing inexplicable.
29th March 2019
Today I inserted ethernet surge arresters at each end of each ethernet cable going to the Geiger counters. I am by no means certain that lightning-induced surges on the ethernet are causing the problems with the counters locking up — I would have thought that a simple over-voltage surge would cause physical damage to the port rather than inducing the sort of weird software lockups that I've seen — but I might as well give it a try.
The surge arresters, by the way, are cheap ones from eBay which I upgraded. These were about $5 each and I considered it better to get these and modify them than purchase ones from a reputable supplier like Novaris for $120 each. These surge arresters were originally fitted with P6KE15CA transient voltage suppressors which are rated 40 A and nominally clamp to 15 V, I replaced them with 1.5KE6.8CAs which are rated 220 A and clamp to 6.8 V, which is a much more appropriate clamping voltage for ethernet.
Over the past couple of weeks there have been a few showers of rain which have resulted in the radon washouts listed below. In all cases the magnitude and duration of the washout has been linked to the nature of the rainfall with nothing unexpected happening.
| Date | Approx Time | Approx Level |
|---|---|---|
| 16th Mar | Around midday | about 2% |
| 16th Mar | 8:30 pm to midnight | 3.6% |
| 17th Mar | 4:30 to 7:00 pm | 3.5% |
| 18th Mar | 2:00 to 4:00 pm | 3.8% |
| 22nd Mar | 11:30 am to 12:30 pm | 5.7% |
| 27th Mar | 2:00 to 5:30 pm | about 2% |
15th March 2019
Today there was a bit of rain for once. Rather than pass by to the North or South as rainstorms generally do, a fairly strong rainstorm came over the top of this area. Unfortunately there was a close lightning strike right at the start of the storm which took the two Geiger counters off line, as well as locking up the firewall, causing partial failure of the Ethernet switch and killing three temperature sensors in possum boxes. It's still not clear how this all happened; I have actually gone to some lengths to protect these devices from lightning induced surges.
Anyway, the lightning hit at a bit after 4 pm and I got the counters running again at about 5:30 pm, so we completely missed whatever washout had happened at that time, however there some more heavy rain later that evening and there was a second washout peaking at about 9% above average at 8:30 pm. The level of this washout was probably boosted by water overflowing from the tank — it appears the tank inlet screen got blocked up again with cemented dust during the hot, dry summer.
12th March 2019
Today there was a small but steady rise in level until about 5 am, followed by a fall until about midday, followed by a gentle rise. The levels involved were very low (max 2.8 % above average, min 2.7% below average) but statistically significant. This is the sort of effect you'd see with about half a day of steady rain, except that there was no rain and instead the temperature was unusually hot for this area (around 37°C).
It might be that with this unusually hot and dry summer we are seeing changes in radon emissions related to soil moisture content or water table level, but of course this is just a hypothesis.
It seems that solar radiation is unlikely to be involved, in fact this station was installed at the tail end of Solar Cycle 24 (Wikipedia has a useful introduction to solar cycles), which was a particularly weak one, and we're currently at a Solar Minimum.
7th February 2019
After virtually no rain for pretty much the entirety of January, there has been light and intermittent rain since the start of February. There were a few tiny radon washouts corresponding to showers over the past few days, but these were on or below the level of statistical significance, so I didn't bother to report them.
Looking back over the last week's data, a more noticeable effect is that the background rate dropped by a bit over 0.002 μSv/h on the evening of the 5th Feb. This would have been caused by the soil in the area becoming wet. If there's no more rain, you'll see the level gradually ramp back up again as the soil dries out.
Supposedly, what's happening here is that the wet soil traps more radon underground, preventing it from being released into the air. It's also possible this water is shielding the counter somewhat from radiation emanating from the soil.
22nd December 2018
A bit more radon washout peaking at about 3.5% above average from about 3 to 5 am today, this is the tail end of the storm that passed through yesterday.
21st December 2018
There were some storms in Brisbane today. They mostly missed this part of the city, but there was enough rain to create a radon washout peaking at a bit over 5% above average. This occurred from 7:30 to about 10:30 pm. It looked like in this case the rainfall was hard enough that it was knocking radon daughters out of the air faster than they could decay away, allowing the levels to build up over the duration of the storm. I will really need to set up some rainfall monitoring because it would be interesting to see whether this is simply an effect of rainfall rate or whether there's more to it than that.
9th December 2018
At about 10 pm there was a drop in level by about 2.5% lasting perhaps 20 minutes. This is the first event I have seen that has no obvious explanation. It's only barely statistically significant, so it's possible this is still a random statistical error - given enough time there will occasionally be deviations outside the three-standard-deviations level that I'm using to denote statistical significance.
4th December 2018
Radon washout peaking at a bit over 2.5% above average between 4:30 and 8:30 pm, corresponding to relatively gentle but prolonged rain. The Cable Internet is now down and has been down since 8 am yeasterday.
28th November 2018
Radon washout peaking at a bit over 3.5% above average between 12:30 and 1:30 pm. This corresponded to a very brief but very strong shower of rain. Usually the magnitude of a washout corresponds more strongly to the strength than duration of the rainfall, but in this case it appears that the duration was short enough that it prevented the rate from rising as high as I would have expected.
Also, I've just changed the graphing software to include an extra decimal place in the statistical data. I use this data to calculate the strength of radon washout events and for very small events the round off error was becoming significant.
23rd November 2018
There was a drop in the radiation reading of about 3% between 1:30 and 2:30 pm. This corresponds to the time a plumber was working under the house behind the Geiger counter. There did not appear to be any malfunctioning of tubes due to bumping, so I suppose he must have been close enough to it that his body was blocking radiation coming from under the house.
I'm a bit surprised at the magnitude of this effect. The counter is intended to detect radiation coming primarily from in front. There is an aluminium plate behind the tubes, and then a moderately thick steel mounting plate behind that which will shield them from beta radiation and less energetic gamma rays. I wouldn't have thought that the more energetic gamma rays that could penetrate through this metal would be blocked to any great extent by a human body.
22st November 2018
Radon washout peaking at a bit under 2% above average between 11:30 am and 13:30 pm. This increase is statistically significant, but only just. I was disappointed by the weather today - there were storms about and a lot of rain forecast, but pretty much everything missed us and we got only a brief shower that caused a feeble washout.
21st November 2018
Radon washout peaking at about 5% above average between 7 and 8:30 pm.
17th November 2018
There was a very small radon washout peaking at about 2.5% above average, which is just above the threshold of detection, from about 6:00 to 8:00 pm this evening. This corresponded to a small shower of rain.
Cable Internet has now been good since the 11th, however the cable system has apparently been transferred from Telstra to the NBN and it's possible there will be more disruptions to come in the future.
8th November 2018
There was a very small radon washout peaking at about 2.5% above average, which is just above the threshold of detection, from about 8:30 to 10:30 am this morning. This corresponded to a small shower of rain.
Meanwhile, Cable Internet problems continue.
27th October 2018
For the last couple of days, the cable Internet has been dropping out for extended periods, so if you have been unable to access this site, that is the reason. I do not know how long this situation will last.
21st Oct 2018
There was a radon washout peaking at 8.5% above average from about 2:00 to 5:00 pm today, corresponding to a particularly sudden and strong hail storm. Comparing this level to the levels measured in September during somewhat less severe storms, it looks as if the overflowing tank (which was interfering with measurements during that month) was boosting the levels by about a factor of two.
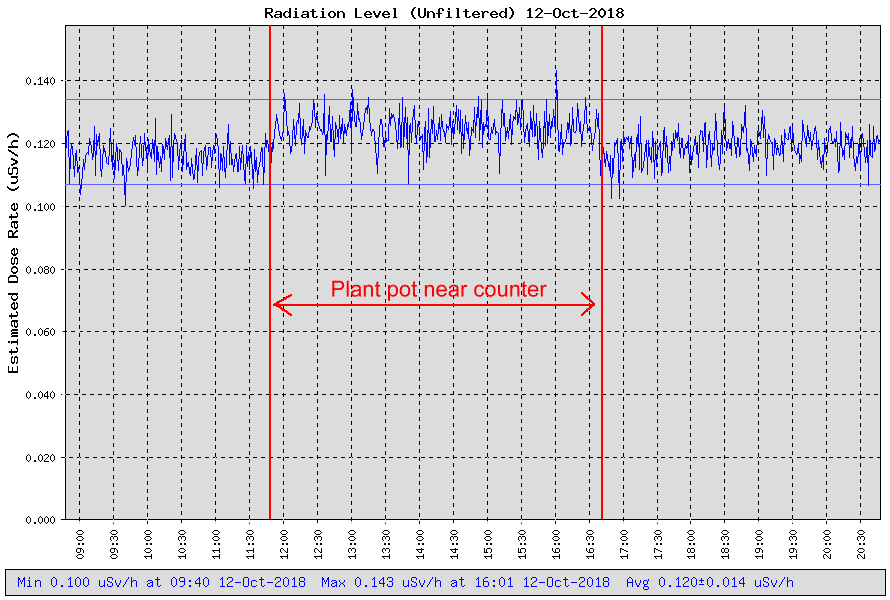
12th Oct 2018
From about 1 to 3 pm yesterday there was a radon washout reaching a bit under 5% above average. Unfortunately, at the peak of this washout (1:47 pm to be precise), counter 1 locked up. There has been lightning about, which I assume must have been the cause. I didn't notice this until today; when I did I was able to restart the counter successfully, but meanwhile half of yesterday's data was recorded at reduced accuracy.
This was annoying, but today I also discovered something even more annoying:
I had been moving stuff around under the house behind the counters in order to allow plumbers better access to a pump in that area, when a noticed small, but sudden and unexplained changes the radiation reading. I did some checking and it seemed that the position of a large empty ceramic plant pot was implicated; however it had also been raining on and off all day and plumbers had been moving around near the counter, so it was by no means certain. I ended up conducting an experiment by moving the suspect pot right beside the counters and leaving it there for a period of about 5 hours. The results were fairly conclusive; the pot had been affecting the readings. Here is an plot (unfiltered readings show it best) of the test:
And here is a photo taken in September last year, before the counters had even been installed, showing the culprit hiding behind the counter box.
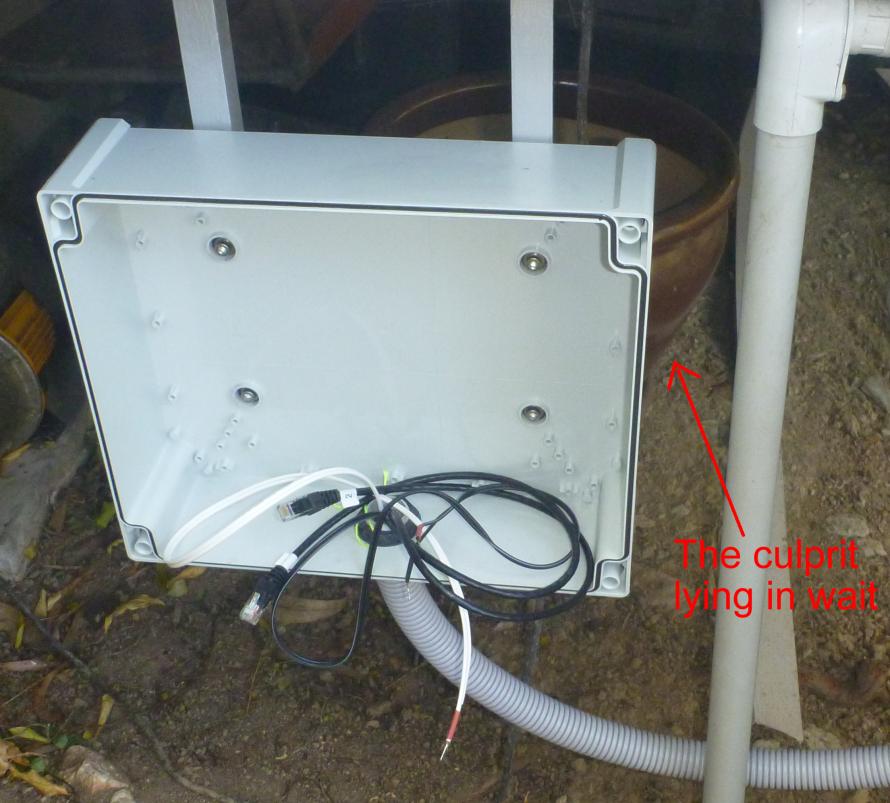
The pot has a reddish brown glaze on it. It's not one of those really old ones where they deliberately used actual uranium salts in the glaze, but it would appear that there is enough uranium (or possibly thorium) in it to affect my sensitive counters. The level is still very low; I don't think it would be enough to be detectable on a hand-held counter although perhaps an alpha-sensitive one might pick up something in contact with the surface.
This is quite annoying, but isn't a disaster. The counter has never been calibrated against an accurate reference and the calibration factor for the tubes comes from an unofficial source. While I believe this calibration factor is very close to the true figure, the margin of error in it is greater than the offset that would have introduced by the presence of the "hot pot". This offset would have been less than half that shown in the plot above because the pot had been deliberately moved closer than normal to the counters for this test. More importantly it won't have affected the relative measurements, which are of more importance. The main annoyances are that:
- All of today's readings are screwed up,
- Unless I replace the pot in its exact original position, the accuracy of very fine-grained comparisons involving data before and after today will be suspect, and
- It's just annoying to be caught out by something like this.
6th Oct 2018
There was a radon washout peaking at a bit under 10% above average starting at midnight and finishing about 5 am, and also a smaller one from 5 to 8 pm peaking at about 4% above average. There were also very small washouts at about 4 pm yesterday and midday today which were barely over the limits of detection (a fraction over 2% above average - the detection limit is about 1.5%) and probably shouldn't be officially counted.
I have just discovered one thing that could have been causing the radon washouts during September to read higher than normal:
The mosquito filter on the inlet to the house water tank was clogged with dirt which had hardened to a cement-like consistency during the previous dry months. This had been causing rainwater to overflow over the sides on the tank during heavy rain. The problem is that the Geiger counters are located downhill from the water tank, and this overflow water would have been flowing directly under the counters, thus bringing a higher than usual proportion of the washout into their vicinity. I cleaned the filter at about 5:30 pm today, so we'll see what happens from this point on. If we don't get any more 15+% washouts, then this might have been influencing the readings.
This effect is something worth considering when setting up a radiation monitoring station: The presence and amount of rainwater under a counter may possibly affect its readings and for consistency it would be logical to avoid large and irregular flows of rainwater in its vicinity. Keeping the thing under cover - so that it's away from rainwater altogether - is probably not a good solution because what you're wanting to measure is to a large extent contained in the rainwater. Possibly it would be best to locate the counter on flat, level, well-drained soil. Unfortunately there is nothing like this in the area.
30th Sept 2018
There was the strongest radon washout so far recorded today. It peaked a bit over 17% above the long term average, or 18.5% above the immediately preceding average. The event started around 7 am and took until about 3 pm to fully die away. The profile of the event had two distinct peaks and it looked as if a second radon washout had started before the previous one had decayed away.
I probably need to add some context here because these figures could appear concerning if you're not aware of what they mean in practice.
The additional external radiation exposure that an individual would receive as result of this (particularly large) event would be only about 0.06 μSv, which is 2% of the average daily external dose. But a person is also subjected to an internal dose of radiation from radioisotopes (mainly naturally occurring potassium-40) inside their body, so their total increase in radiation dose would in fact be less than 1% for the day.
However, this is a worst-case calculation because it leaves out the very important fact that the event is also washing out of the air radon and daughter products that you would otherwise breathe in; so while you external radiation dose is increased by the washout, your internal dose is also decreased. Without an analysis of the radon content of the air, I can't give any sort of useful figures on the relative magnitudes of these effects, however radon and its daughters contain a high proportion of alpha emitters which are particularly damaging when breathed in (but harmless when outside the body), so even a relatively small decrease of radon in the air would have a significant effect and I would strongly believe (although cannot at this point definitively prove) that over all radon washouts reduce your radiation dose overall.
29th Sept 2018
There was another unusually strong radon washout peaking at a bit over 15% above average starting at about 3:30 pm this afternoon and finishing around 7:30 pm. Like last time it corresponded to a sudden fall of rain.
8th Sept 2018
There was an unusually strong radon washout peaking at a bit over 15% above average from about 4:00 to 7:00 pm today, corresponding to a fall of rain. The fall of rain was somewhat sudden but didn't appear to be much stronger than what occurred a few days ago, so it isn't clear why this event was so much more strong.
3rd Sept 2018
There was a radon washout peaking at a bit over 6% above average from about 3:00 to 5:00 pm today, corresponding to a moderately strong fall of rain.
26th August 2018
There was what I would have to call a "Radon Washout Non-event" last night.
After a long dry spell (much of the country is officially in drought), there was significant rainfall starting at perhaps 11:30 pm last night. There would have been about 10 mm fall here. I had expected there to be a significant radon washout event, but instead there was nothing detected at all. The only noticeable effect was that since midday, radiation levels dropped by an amount that was just on the borderline of being statistically significant (about 0.003 μSv/h). This effect (if real) would make sense since it is claimed that wetting soil inhibits the release of radon.
My hypothesis is that the rain must have been sufficiently light that it washed radon daughters out of the air more slowly than they could decay away. I really need to start monitoring rainfall here to test this out.
24th June 2018
The ethernet cable on the server was accidentally unplugged from about 1:00 to 4:30 pm. There is no reason to suppose that anything was missed during this period.
14th June 2018
There was a radon washout from about midnight to 3 am this morning, corresponding to a brief but moderately heavy shower. The washout reached about 6% above average. This is the first statistically significant event we have had in over three months. It would seem that the more sudden rain showers that we have in summer are more likely to cause noticeable radon washouts.
5th Mar 2018
There was a radon washout starting at 10:30 pm tonight and continuing on until about 3:30 am the following morning. This is unusually long for a washout event and may have been caused by the start-stop nature of the rain which fell over this period. The washout only reached about 4% above average.
26th Feb 2018
There was a radon washout at 8-10 pm tonight. The rain was very intense, but the washout only reached 4% above average. There has been considerable rain over the last week, so I think there is less radon left in the atmosphere to wash out.
17th Feb 2018
There was a severe storm last night. It would have been interesting to see what sort of radon washout we had, but unfortunately we lost power at the same time. This time power was out for two hours (6-8 pm), which was just long enough to completely miss any radon washout event. :(
11th Feb 2018
There was a brief but particularly heavy downpour of rain starting at about 6:40 pm today. This caused a radon washout peaking at 15% above average. Unfortunately, the power went out just when the rain was at its strongest, losing us about 5 minutes of data. It is possible that the peak would have been even higher if this data had not been lost.
To avoid loss of data during power outages, I would need to add a backup power supply for the counters and also put the server on a UPS. The former would be comparatively easy to do (it's a 12VDC supply, so I can just use a battery), but a good UPS is comparatively expensive, and a cheap UPS is likely to cause more problems than it solves.
Although logging restarted automatically this time, this does not mean the problem I referred to last time has been completely solved. The issue with the counters not restarting appears to be related to an extended outage which we did not experience this time. I have a theory why this may be happening, but will need to do further testing to verify it.
5th Feb 2018
Today, logging was down from 2:50 am to 10:30 am. This was due to logging software on the server not restarting after a power interruption (a simple error and my fault for not wanting to power cycle the server to test the setup), however the counters also did not restart correctly, despite the changes made in November of last year. Further investigation is needed because software-wise the logic should be pretty much foolproof.
27th Jan 2018
This "News" page was added to the site.
24th Jan 2018
Both yesterday and today there were spurious spikes in the data between 7 and 9 am. On examining the database, these were shown to be caused by tube 4 on counter 2 (again). I also discovered another previously overlooked spurious spike on 19th Jan 2018 from the same cause. I think sunlight may be hitting the counter at this time in the morning, which could be causing this tube to play up.
I have now replaced this tube with a spare and deleted the invalid data from the database. The suspect tube was manufactured in July of 1981, but is not the oldest tube in the counter. I have more spares which can be used should more of them fail.
While I was at it, I also modified the monitoring page to allow you to select dose rate in μR/h. It appears that in the US, this is used in preference to μSv/h for civil defence purposes. I have used the conversion factor of 100 R = 1 Sv, which is arguably wrong, but is is what FEMA (Federal Emergency Management Agency) use for this purpose and I might as well be consistent with them.
20th Jan 2018
Between 07:40 and 8:15 there was a temporary malfunction of tube 4 on counter 2 which created a spurious spike at twice the background level. I have manually deleted the erroneous data from the database. You will not see a gap in the monitoring because valid data from the other tubes exists - the only effect will be that for this period that statistical error will be slightly higher, but only by a fraction of a percent.
2nd Jan 2018
There was a radon washout at 19:00-21:00 peaking at 5% above average.
1st Jan 2018
There was a small radon washout at 17:30-18:30 peaking at 3% above average.
31st Dec 2017
There was a radon washout at 14:00-17:00 peaking at 7% above average.
25th Dec 2017
There was a large (by the standards so far) radon washout 19:00-21:00 peaking at 9% above average, followed by a smaller one from 23:00 to 01:00 the following day, which peaked at 5% above average.
11th Nov 2017
This monitoring station was officially launched on the web.
5th Nov 2017
The software in the counters was modified to automatically restart should it lock up. This uses the hardware watchdog timer in the microcontroller and is triggered by either a lockup of the counter software, or of failure of comms with the monitoring computer. As well as performing a reset of the CPU it also performs a hardware reset of the ethernet module, so it should be virtually foolproof.
14th Oct 2017
The software in the counters stopped communicating to the server during a thunderstorm, probably due to a network glitch.
10th Oct 2017
The second Geiger counter was installed.
22nd Sept 2017
A radon washout event was detected from about 8 to 9 pm. It is encouraging that even with only one counter installed the station is capable of picking up the relatively small change in background level this involved.
19th Sept 2017
The first Geiger counter was installed and logging started.