FAQ
Last updated: 8th May 2022
Why did you build a radiation monitoring station?
The idea was first conceived in 2016. This was the year that Donald Trump was elected and North Korea resumed nuclear testing. While these things were bad in themselves, the bigger problem was that they seemed to be symptomatic of a world-wide political decline. There were a lot of bad things going on everywhere; this was the year of Brexit and the worthless failure Malcolm Turnbull was returned to power here in Australia.
Events over the subsequent years have not changed my views on this matter.
I did not believe at the time, nor do I believe now, that the end-game of this decline is necessarily going to be a nuclear war, yet the chance of it happening has been increased. In fact, I feel that the chance of some sort of nuclear conflict is higher than it had ever been in my lifetime. Bear in mind that I am in my 50's and have lived through most of the Cold War.
I believe that an apocalyptic full-on nuclear war is unlikely, yet the chance of a bomb going off, probably through accident or stupidity, is non-negligible. And there is always the chance of a reactor blowing up somewhere; none of the world's reactors are getting any younger and in this era of economic decline and corporate irresponsibility, maintenance probably does not get the priority it deserves.
Were a nuclear incident to happen, I felt it would be useful to have some form of fallout monitoring in place. There is not to my knowledge any official monitoring network in Australia [ARPANSA promised one in 2018, but it never eventuated] and I could easily imagine a deluge of misinformation and panic drowning out any useful information were something unfortunate to occur. Subsequent events — namely the response to the COVID-19 pandemic — have strengthened my believe in this.
By building my own monitoring station I could at least get information that, if not as accurate as that from a professionally built station, is at least trustworthy (in the sense of being under my personal control) and relevant to my exact location.
So over the following year I designed and built the station. It was up and running in September 2017 and was officially launched on the web in November of that year.
This station uses Geiger tubes. Maybe a scintillation counter would arguably have been better - these are very sensitive and can give you an idea of what's in the fallout. However, a scintillation counter is much more expensive (thousands of dollars rather than a few hundred) and complex to set up.
That said, I have used an array of relatively sensitive Geiger tubes and this station is significantly more sensitive than most other amateur stations I've seen. With the default 1 hour filter, it can pick up changes in background level above +/- 1.5%, so it should give at least some idea of what's going on.
What do you mean by "Radiation"?
Throughout this page I have used the term "Radiation" for the purposes of brevity. Technically I am referring to ionising radiation, and more specifically gamma radiation above perhaps 20 keV. The Geiger tubes in this station will not detect alpha radiation and have an unknown (and probably low) sensitivity to beta radiation.
Ionising radiation is the unequivocally bad stuff you get from nuclear fallout. This station is not concerned with non-ionising radiation, such as one gets from WiFi, mobile phones etc.
What does the monitoring station consist of?
This station was custom designed and built. It consists of two nominally identical Geiger counters which are located in the same enclosure but operate independently. This provides some level of redundancy - the station can continue monitoring (although with reduced sensitivity) if one counter fails or requires maintenance.
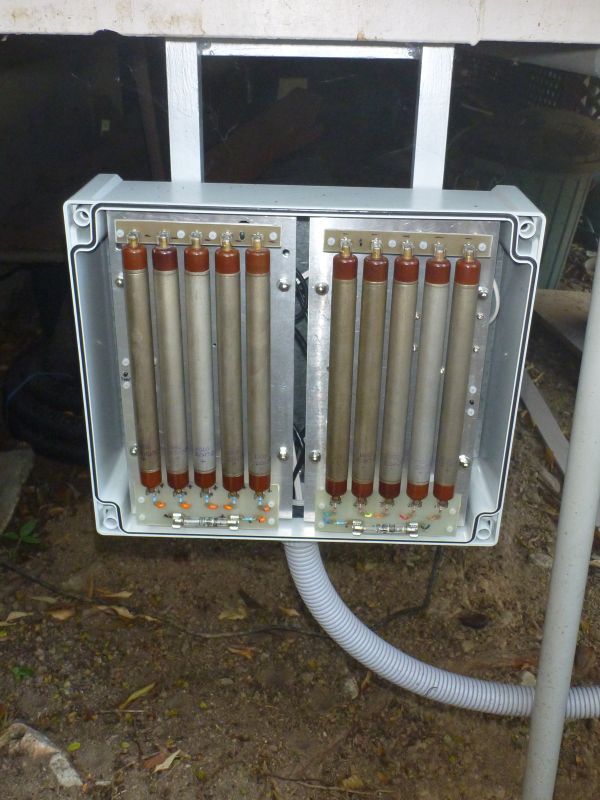
Each counter uses a total of five SI-22G tubes and one SI-3BG. The pulses from each tube are recorded separately, this allows failed tubes to be detected and also provides the opportunity to cross-check readings; a sudden increase on one tube is most likely not real (i.e. a faulty tube or a statistical artifact), but an increase on all tubes simultaneously is most likely real. This is part of the reason why a total of ten SI-22Gs were chosen rather than a single, more sensitive, pancake type tube. Another reason is that pancake tubes are more delicate and expensive and there is a greater risk of them being damaged in transit when being shipped from the other side of the world.
The SI-3BG is a high-range tube used in Soviet-era military Geiger counters. This tube is useless at background levels — you get one click every five minutes or so. The reason for including it is just in case there is heavy fallout. One problem with Geiger tubes is that they suffer from an effect known as fold-back; beyond a certain level of radiation, the higher the radiation level, the lower the count rate. This can make them dangerously inaccurate at higher than expected rates. As the SI-22Gs are quite sensitive, this fold-back happens at a relatively low level, and while this level is still way above background levels, it could potentially be exceeded during heavy fallout.
Now the chance of heavy fallout in this part of the world is extremely low, but there are still scenarios where it may occur. Nuclear-powered (and possibly nuclear-armed) warships occasionally visit Brisbane. Were a reactor to melt down with the wind blowing the wrong way, things could get very unpleasant here. Mainly though, I didn't want to knowingly design a monitoring station that was going to fall over just when it was needed the most.
The Geiger counter circuit is based on the Theremino Geiger adaptor, which is a simple yet stable and efficient design.
In addition, the monitoring station uses an Arduino Nano clone as a brain and an ENC28J60-based Ethernet board to communicate with this server. This is very cheap hardware, but seems so far to be adequate for the job. Data is logged in a database on this server and is retrieved by a custom-written program which displays it in graphical form on this site.
Where did you get the Geiger tubes from?
The tubes are "New (old stock)", purchased from a Ukrainian seller (any-devices) on eBay. They were manufactured by the Soviet Union in the 1970s and 80s but are (supposedly) unused. Everything I have purchased from this seller has worked, although often shipping takes some time.
How do I interpret this data?
Currently, the normal background rate for this area is 0.12 +/- 0.01 μSv/h. Note that this is μSv/h; i.e. millionths of a Sievert per hour.
Normally this rate will remain steady, with fluctuations mainly caused by statistical noise. You can get an idea of how much statistical noise is present by turning on the Error Level indications.
The Error Level indications consist of upper and lower lines on the graph. It may look as if they indicate maximum and minimum values, but in fact they are set to three standard deviations plus and minus the average value for the period. In English, this means that any change outside of these lines has a 99.7% chance of being a real change. The nature of the statistical noise on a Geiger tube means you can never be 100% sure that a change is real, however by sampling a lot of data (which is what we try to do here), we can get very close.
I could instead have used error bars, but I have found that with this particular data, error level indications are easier to interpret. If the trace goes outside the lines the change is real; if it stays between them it is not.
The Error Level indications are helpful for periods up to a few days. Beyond that, long term drift makes them less useful. It would probably be possible to make these error level indications track the average to some degree so that they would be more useful over a longer period, however this has not been done (and needs to be approached with caution so as not to be misleading).
Under natural conditions, there are two main things I am aware of which may cause changes in the radiation level; changes in cosmic radiation and "radon washout events". The Bureau of Meteorology have a Guide to Space Radiation, which explains about Cosmic Radiation (and provides a very useful summary of radiation in general and is worth reading for this alone), however it is not clear to what extent this will influence the radiation readings at this site. It would seem likely that a large solar flare would be detectable.
What is a Radon Washout?
There is a certain amount of uranium in the earth's crust. This decays over time through a series of other radioactive elements before finally ending up as stable lead (do a search for "Uranium decay chain" or "Uranium series" for more detail). At one point in this series, the radioactive gas radon is formed. This is a noble (inert) gas which does not combine chemically with other elements in the crust, consequently it is free to move through any cracks that may exist in the ground and a certain amount makes its way into the biosphere.
Radon has a half-life of about four days and decays through a series of daughter products, most of which also have short half-lives. Although radon is an inert gas and floats freely through the air, its daughter products tend to stick to stuff and attach to dust particles in the air.
Under normal circumstances, radon and its daughter products are present in tiny amounts in the air where they can be breathed in. Although the quantities are extremely small, it is fairly potent and approximately 1/8th of a person's natural background radiation dose is caused by radon and its daughters. To put this into perspective, it's the equivalent of having slightly less than one X-ray every two years. Radon can be a problem in mines or poorly ventilated houses in areas with a high uranium content in the soil. Radon is also produced by products containing radium, so if you crack open the front of a clock with radium-painted hands, you are likely to get a face full of radon (not recommended). In Australia the risk from radon is mostly low compared to the rest of the world.
A Radon Washout is where heavy rain knocks a significant portion of the dust particles in the air out into the rainwater. These take the radon daughters out of the air, and in addition radon itself is somewhat water soluble so some will also be washed out of the air.
The effect of a radon washout is that the radioactive material that was floating around in the air is now brought to the ground via the rainwater. This means that a Geiger counter close to ground level will register an increase in radiation due to the radioactive material being brought into closer proximity to it - there is no actual overall increase in radiation level in the biosphere. Incidentally, a standard Geiger tube cannot detect radon itself but I think is instead responding mainly to gamma emissions from the daughter products lead-214 and bismuth-214.
I haven't investigated the mechanics of radon washouts in any sort of detail, but it seems that very sudden and heavy rainfall seems to create the biggest radon washouts. Low intensity rain appears to wash out the radon daughters less fast than they can decay away and often doesn't register on the Geiger counter.
Radon washout events detected by this monitoring station are documented on the News Page. So far, the largest event witnessed (peaking at 18.5% above average) was on 30th Sept 2018. It subsequently turned out that the magnitude of this event was artificially boosted by an overflowing rainwater tank near the detectors, however it was still a large event and would probably have been the equivalent of a 15% increase under normal circumstances.
What are the health effects of a radon washout?
I haven't found any studies on this, but I can make some guesses. On one hand, you will be breathing in less radioactive material: radon itself and its daughter products polonium-218 and polonium-214 are all alpha emitters which are pretty much harmless outside the body, but do significant damage when breathed in. On the other hand, you will be more exposed to slightly more gamma radiation from the material lying on the ground. While I don't have any objective data on this, alpha emitters inside the body do way more damage than external gamma rays and I would strongly suspect that a radon washout would over all decrease a person's dose of radiation.
But what if you get the rain water on you or drink it? I think getting rain water on your skin isn't a big deal. The alpha emitters in it still won't be a hazard and while you would be slightly more exposed to beta and gamma radiation for a short period, the dose will still be tiny. As for drinking the water, I would probably not recommend licking up rain water that had fallen during the first few minutes of a rain storm (although in the over-all scheme of things it isn't a big deal, after all, wildlife have been happily lapping up fresh rainwater since forever). I wouldn't worry about drinking rain water from a tank; if you have a first flush diverter it will eliminate virtually all of the washout, as will a carbon filter, and if you have neither, the incoming rainwater will still be greatly diluted by existing water in the tank. I suppose if you were being extra cautious, you could leave it a couple of hours before drinking the water - the most active of the radon daughters will have decayed away by this time.
But please put this in perspective; the doses of radiation involved here are tiny; a person's background radiation dose from natural sources is very small and radon contributes only a small proportion to this. Radon washouts occur only occasionally and last for only short periods. The over all effect (positive or negative) of radon washouts, taken as a proportion of your yearly dose, is not going to be very much and there are plenty of other things much more worth worrying about.
What about bushfire smoke?
With a conventional radon washout discussed above, the main issue is the radon itself and its short-lived daughter products; however there is also a different issue related to its longer-lived daughter products. These can potentially become an issue during bushfires.
To get an idea of the nature of the problem, we have to look at the decay of radon in more detail. Radon itself has a half-life of about four days and most of its daughter products have even shorter half-lives, with the big exception of lead-210, which has a half-life of about 22 years. Lead-210 decays via bismuth-210 to polonium-210, and then finally to stable lead-206.
Lead-210 and bismuth-210 aren't much of a hazard but polonium-210 is very nasty. It's a strong alpha emitter and dangerous if breathed in or ingested. If the name sounds familiar this is because it was the substance used to assassinate Soviet defector Alexander Litvinenko.
So what we have is radon seeping out of the ground, dispersing into the air and decaying quickly to lead-210, which then settles out to accumulate in the soil, on foliage and so forth. This lead-210 continually generates polonium-210 as it decays. It might sound scary that this dangerous isotope is continually building up in the environment, but there is a mathematical limit to how much it can accumulate, and mostly the level is very small indeed.
However, polonium-210 on foliage can be problem in some cases. Apparently, smokers get a significant dose of radiation from polonium-210 on tobacco leaves, and it appears likely that a portion of the lung cancers suffered by smokers is attributable to this cause.
Bushfires are like tobacco smoking on a massive scale: millions of tonnes of foliage gets burnt. Its smoke is breathed in by people (and animals, who don't have the luxury of smoke masks) and its ash falls into creeks and water supplies. Depending on what ends up where, the lead-210 and polonium-210 - which previous existed at harmless levels through thousands of hectares of forest - might end up concentrated to uncomfortable levels in places where it's not wanted, including in people's lungs.
I have found one study that attempts to quantify this effect. This is a 2011 conference paper from the Technical University of Lisbon entitled "Vegetation fires and release of radioactivity into the air" [Reference Fernando Carvalho, João Oliveira & Margarida Malta (2011), DOI: 10.2495/EHR110011 Conference: ENVIRONMENTAL HEALTH AND BIOMEDICINE 2011, Volume: 15]
This tells us:
"Concentrations of both radionuclides [lead-210 and polonium-210] in the smoke samples increased in average by a factor of about 100 compared to the reference sample. Moreover, in all these smoke samples the 210Po concentrations were systematically higher than those of 210Pb, with 210Po/210Pb ratios up to 12."
And that:
"The inhalation exposure to the smoke from vegetation fire over a one day may represent for a fireman a 210Po inhalation about 80 times higher than a cigarette smoker and about 4000 times higher than inhalation of atmospheric background 210Po by a member of the public.""
The moral of the story is to wear a smoke mask if affected by bushfire smoke - it is bad enough for you even without the polonium.
It is not clear whether this monitoring station would detect an increase in radiation levels due to bushfire smoke - Brisbane missed out on the 2019/2020 mega-bushfires, so it has not been put to the test. Polonium-210 is virtually a pure alpha emitter and would certainly be undetectable by this station. Bismuth-210 is virtually a pure beta emitter; it puts out moderately strong beta radiation, but I suspect the tubes I use have low beta sensitivity. Lead-210 puts out some low energy gamma radiation that might be detectable if there was enough of it.
The most recent half hour of data is showing an anomalous rise/fall. Why?
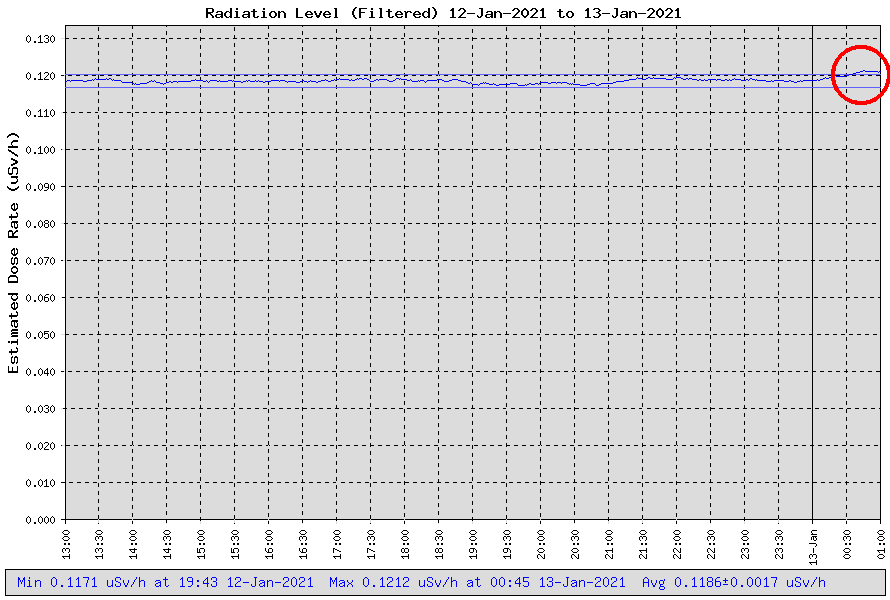
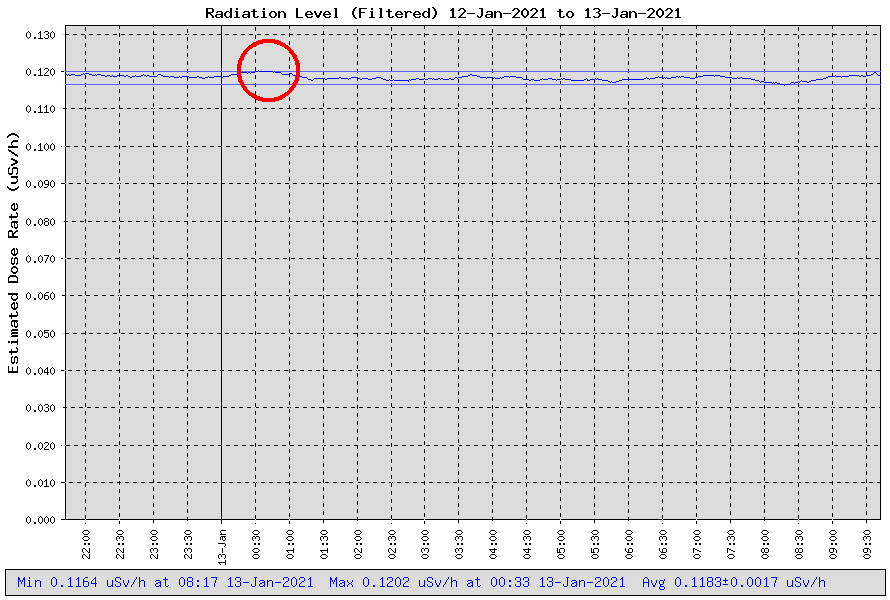
At times it may appear that something unusual or even sinister is going on. The last half hour's worth of data may show a distinct rise or fall in rate, yet looking at the same time period several hours later does not show any rise or fall. Here is an example:
Is there a bug, or is someone editing the data to conceal something?
The tl;dr of this is that the last half-hour's worth of data is not truly reliable because of the way filtering works. I could exclude this data from the graph, but I think it's better to have it than not.
In detail, the issue is this: Pulse counts are sampled every minute, but (by default) they are averaged over an hour; specifically, the rate shown at each point on the graph is in fact the average of all of the sampled data starting half an hour before this point and ending half an hour afterwards.
It is necessary to do averaging in this way in order not to introduce lag into the system, but it has the side-effect that any data shown that is more recent than half an hour before the current time is not in fact an average of a full hour's worth of data, because some of the required data has not yet been recorded. This in turn means the error of this data is higher than it should be. So any minor statistical fluctuation in the rate, that would otherwise be smoothed by the averaging, is exaggerated when it occurs in the last half-hour's worth of data. In addition, within this period the error level increases steadily as the time approaches the present moment and this can create the impression of a stead rise or fall in rate.
Generally, this effect will be small. It will often cause the displayed rate to ramp up or down to just outside the error bars, as shown in the images above (the error bars are not really valid for this data). A larger increase/decrease, and in particular one which is a continuation of a rise/fall that began more than half an hour ago, is most likely to be real.
This is boring! Why is nothing happening?
Nearly all of the time, there will be nothing happening, the radiation level will look like a boring virtually flat line, constant to within a couple of percent (and much of this variation will be statistical artifacts). This is normal and it is a good thing.
If I knew that things would remain like this—generally flat with the exception of an occasional small peak due to radon washout—I would probably not bother with a monitoring station. There's not enough to see to be worth the effort involved. However, if something does happen, it is important to have a good amount of data from before the event for comparison purposes.
So currently the monitoring station can be thought of as performing the unglamorous but highly necessary role of establishing a baseline.
The level is high! Should I panic?
In terms of actual dose, even a quite substantial increase in this background level is (in my opinion at least) not in itself harmful. Elsewhere in the world, people live with apparent impunity in areas where the naturally occurring background levels are up to ten times as high as the level here. However, the point is that if the level is trending upwards significantly, there must be some cause.
Most likely the cause will be a radon washout event. Radon washout events have been part of the natural environment pretty much forever and have not been shown to be harmful. I suspect that radon washout events actually decrease a person's overall radiation dose, because they wash out of the air radon daughter products like polonium which would otherwise be breathed in. I believe that radon daughter products breathed into the lungs are a significant component of the background dose to which we are all subject.
But what if it's not radon washout?
If the level rises more than say, 20% above the usual value (i.e. more than about 0.15 μSv/h), there is something unusual happening. You will need to use your judgement with this; if there are storms about in the Brisbane area it could still be a radon washout (I don't as yet have enough data to determine how far these things can go). Bushfire smoke may also have some effect (this is also yet to be determined). If there are solar flares mentioned on the news, this could be the cause, and of course if there is reason to believe that fallout from some event may be on the way, then this might be what you're seeing.
Bear in mind that the chance of a nuclear disaster affecting this part of the world is very low and the chance of fallout reaching us before such a disaster was in the news is even lower. Consequently it is more likely to simply be a fault in the counter, or some localised event (maybe someone who has been treated with medical radioisotopes is standing near the detector or the guy next door has done some landscaping with rocks with monazite in them etc. etc.). I will try to post a notification if something anomalous happens. If you are concerned, your priority should be to check other monitoring stations; this should give a better idea if the event is real, and if so, what areas are being affected.
OK, but what levels are actually dangerous?
If you are genuinely interested in knowing about the dangers of ionising radiation, the web is one of the worst possible places to find this information. You have every extreme from those claiming that almost undetectably small doses of radiation have extraordinarily devastating effects, to those who claim that doses which are on the borderline of causing acute radiation poisoning are actually health-giving. And of course everyone claims that everyone else is either a fanatical tree-hugger seeking to have us all live in caves or an evil member of the military/industrial complex bent on destroying the world.
However, it turns out there is actually objective information out there. You should try to find a copy of ICRP Publication 103. ICRP stands for International Commission on Radiological Protection and is an independent (non-government, non-industry) commission of medical professionals that has been around since 1928. That's not a typo; by 1928 people had been burning themselves with X-ray machines and getting poisoned by radium long enough that things needed to be done. They view things from a medical perspective and their purpose is to weigh up the positives (X-rays, radiotherapy) against the negatives. This is in contrast to other organisations such as the IAEA (International Atomic Energy Agency) and the ANSTO (Australian Nuclear Science and Technology Organisation), whose stated aims include the promotion of nuclear technology and therefore have something of a conflict of interest when it comes to safety.
ICRP Publication 103 is not distributed free of charge, but with some searching it is possible to find copies on the web. If you can't find ICRP Publication 103, one document that is freely available is BEIR VII Phase 2. This is useful and objective and in fact the ICRP publication itself uses information from this report.
A problem here is these publications are both lengthy (300-400 pages) and contain a lot of detail, and it's super annoying to ask the question "is X dangerous" and have to spend an hour reading only to find out the answer is "it depends".
A rough guide:
The range of 0.1 to 0.2 μSv/h is normal for Australia. Some places might go to 0.25 (different figures are quoted by different people and I have been unable to find any definitive data). A few specific places (generally near mines and mineral outcrops) will be higher; E.g. if you visit a place like Radium Hill, you can assume the level will be somewhat higher than average.
Some (although admittedly few) places in the world have natural background levels of up to 1 μSv/h. Such places are permanently habitable without apparent ill effect. My understanding is that anything under about 1.5 μSv/h is suitable for permanent habitation; this is based in ICRP data, although they do not make any specific recommendations on this.
Above this level, it starts getting complex because the duration of exposure comes into play. For instance, the 1.5 μSv/h figure above was based on the total dose over a lifetime. So a 40 year-old person (who is unlikely to live more than another 40 years) could probably tolerate a dose rate of closer to 3 μSv/h for the rest of their life; but only if they had been exposed to more moderate background levels in the past.
Another factor when considering long-term issues is that radioisotopes decay over time. Most naturally occurring radioisotopes (uranium, thorium and potassium-40) have extraordinarily long half-lives and don't decay noticeably over a human lifetime. Even short-lived natural radioisotopes (radon and its daughter products) are created by the decay of uranium and thorium and so are maintained at relatively constant levels. Man-made contamination, however, often consists of radioisotopes with comparatively short half-lives.
So moving into a contaminated area with a high background level, with the intent of living there permanently, might be OK if it's known that the level will decay quickly enough that the total dose over time remains low.
I think it would be fair to say that levels between 1 and 10 μSv/h are not acutely dangerous. Of course it is always prudent to eliminate unnecessary exposure to radiation, but the risks of levels like this are still very low. We are exposed to levels in this range when we fly (I have measured up to 3.5 μSv/h in an aircraft in flight). You could live in an area with such a rate for an extended period (although ideally not permanently) and your main concern would not be the background level itself, but more if you were consuming contaminated food and water.
I probably need to stress this point. Except for a very few locations, a background level above 1 μSv/h would be due to man-made contamination. In this case, the external background radiation (i.e. what we are measuring at this monitoring site) may be less important than the effects of taking this contamination into your body; either through food or water, or (particularly importantly for some contaminants) breathing it in. To make sensible decisions on safety, you need to know exactly what contamination is present. A private individual would be unlikely to have sufficient information to make this judgement (and most certainly this monitoring site does not provide this information).
For what it is worth, I do not believe that an isolated nuclear disaster in the Northern hemisphere, such as a reactor meltdown or an accidental bomb detonation, would send the levels in this part of the world even close to 1 μSv/h. Quite possibly it would be barely detectable by this monitoring station (which can in theory pick up an increase of 0.002 μSv/h). Why did I build the station if this is the case? Because a) I might be wrong, b) A larger disaster, or one closer to home, is not impossible and c) If the media were unjustifiably stirring up panic after an incident by claiming high levels of contamination, it would be helpful to be able to prove them wrong.
From 10 to perhaps 100 μSv/h, you start to get into area of chronic radiation poisoning if you live there long enough. At the low end of this range, this takes a period of decades, but as the rate increases the bad effects occur sooner in proportion. At these rates, both internal dose, and decreased exposure due to radioactive decay over time, would be important considerations to factor in. This can get complicated because higher radiation levels are often associated with short-lived radionuclides, so an area with initially higher radiation levels might actually be less dangerous in terms of chronic radiation poisoning if the levels are going to decay quickly. You really need to know what type of contamination is present to make a judgement.
Apparently South Australian regulations require that areas accessible to the public do not exceed 25 μSv/h. [It is not clear whether any places in South Australia exceed this level; I believe that even the former nuclear test sites at Maralinga are now below this level.]. Roughly speaking, hanging around in an area with this rate for a fortnight gives you the equivalent of one whole-body CT scan, so spending long periods in such a place is inadvisable, but a short visit shouldn't be a big deal (although obviously best avoided if you can).
Above these levels (100+ μSv/h) it's a case of definitely keeping away unless you know exactly what's going on. You can assume the cause is man-made contamination spread about the place and you would need to take precautions against this (masks, protective clothes etc.). And, by the way, protective clothing prevents you from becoming contaminated but cannot block gamma rays. If there is a compelling reason to do so, it is possible to work in such an area for a fairly extended period of time (perhaps a few days), but only if proper radiation dose monitoring is being done.
When we start looking at levels 1 mSv/h (1000 μSv/h) and above, we're talking about places where you cannot hang around for any significant length of time; you need to either retreat into a shelter or evacuate.
According to Nuclear War Survival Skills [C H Kearny 1987]: "6 R per day [2,500 μSv/h or 2.5 mSv/h] can be tolerated for up to two months without losing the ability to work". As the name of the work suggests, this applies to war-time conditions where there's the imminent possibility of death from various causes, and I suppose in that case you do what has to be done and hope for the best. But this is what you'd have to call a heroic dose of radiation, appropriate only in the most extreme of emergencies. The total dose you would receive after 2 months exposure to 6 R/day is around 3.6 Sv. If received over a short period, this dose would most likely be fatal under war-time conditions. Received over a couple of months, your chance of survival is increased and would probably be about the same as playing a round of Russian Roulette.
In a civilian context, you probably wouldn't want to remain in an area with a rate of 2.5 mSv/h for more than a few hours (you would be getting the equivalent of a CT scan every 3 hours).
FEMA define a "Dangerous Fallout Zone" as having radiation levels of 10 R/hr (100 mSv/h) or greater. This is a place you keep out of altogether, although properly equipped personnel may enter such a zone briefly for the most critical of activities.
Much higher levels than this are possible. If you're in the direct path of heavy fallout from a nuclear weapon, the level could theoretically reach over a thousand times this amount (10+ Sv/h) during the first few hours. This would be enough to overload even the high-range SI-3BG tube in the monitoring station (quite probably to the extent of physically damaging it), although this is an academic problem since it's inconceivable there would be power and Internet available under these conditions.
A (fairly meagre) silver lining to fallout like this is that the radioisotopes that make it so active are short-lived (in fact, these two things go together). The theory is that if fallout starts off at 10 Sv/h, it will drop to 1 Sv/h after only 7 hours, to 0.1 Sv/h after 48 hours and to 0.01 Sv/h (10 mSv/h) after a fortnight. Unfortunately, I believe this only applies to fallout from a bomb; fallout from a reactor meltdown will not reduce so quickly because it contains a greater proportion of long-lived isotopes, and nuclear waste is pretty much all long-lived. A nuclear waste spill that starts out at 10 Sv/h will probably still measure close to 10 Sv/h a year later - unless the waste gets covered over or physically removed by rain etc.
What about Smart Meters?
The idea that smart electricity meters emit some sort of harmful radiation is a myth put out by anti-environmentalists to frustrate energy conservation measures.
What about 5G?
The idea that the radiation put out by 5G systems is more harmful than other types of non-ionizing radiation appears to have no basis in fact.
What other radiation monitoring sites are there?
Some relevant sites (from nearest to furthest away) are listed below.
I have suggested above that if you feel worried about seeing an increase in radiation level at this station, you should check some of the other monitoring stations below to confirm whether this is real, and if so, what places are affected. I would, however, also strongly recommend that you check these sites out before there is anything to worry about so that you can get an idea of what sorts of rate are normal for these stations. In particular, some stations are prone to weird dips and spikes which don't seem to correspond to real events and you want to be familiar with these so that you don't panic unduly when you see them for the first time.
The Sunshine Coast Computer Club has data from a monitoring station at Caloundra, North of Brisbane. I believe this station sends data to the Nuclear Emergency Tracking Centre.
This site currently uses a highly sensitive Soviet SBT-10 pancake tube (prior to 11th September 2018 they had a less sensitive GammaScout) and a Theremino ion chambers. This latter devices is intended for radon detection but should also pick up other alpha emitters (americium, plutonium etc.) should we be unlucky enough to be afflicted by such things. It will almost certainly detect polonium in bushfire smoke.
The uRADMonitor network has stations worldwide, including one in Forestdale, South of Brisbane. The way this site works has changed over time; by default it currently displays levels of particulate pollution for the stations, but if you click on the DETAILED link you can see other data including radiation levels.
This site does best at monitoring pollutants. For radiation measurement, the monitoring stations mostly use only a single SBM-20 tube; this is approximately 45 times less sensitive than the Everton Hills station. This is undesirable for a fixed monitoring station as it will be unable to pick up things like radon washout events, however it does not render the station useless; it will still pick up more intense and more prolonged events. The effect of using a less sensitive tube is that you have to average over a longer period to achieve a given level of accuracy. The default 1 hour average on this site gives, by my calculations, a +/- 9-10% statistical error.
The Radmon network network has stations in Townsville, Brisbane and several in Tasmania. Most of these use either one or two SBM-20 tubes, although one of the Tassie sites has 4 x SI-180G's which gives a sensitivity of about 10x that of a single SBM-20. Although there is copious graphical data available for these stations, it is unfortunately hard to interpret because a) the zero points of the graphs have been truncated, b) there is insufficient filtering to remove statistical fluctuations and c) they are scaled in CPM.
There is a weather station with radiation monitoring somewhere in Sydney. They are using a Black Cat Systems GM-10 Geiger counter but are apparently not part of the Black Cat Systems network, which currently appears to have stations in the Northern hemisphere only.
Black Cat Systems are somewhat coy about what type of tube their GM-10 counter contains, but I suspect it is an American LND-712. This has about the same sensitivity as a Soviet SBM-20, but can also detect alpha radiation. By my calculations the statistical error would be about +/-10-11% for 1 hour average and +/-2% for a 24 hour average for this tube.
There is the GMC Map network. Like uRadmon and Black Cat Systems, this is a vendor-run monitoring network and consequently has the problem that coverage is limited to the relatively small number of people who choose to buy that particular manufacturer's products. Also, please check the date the data was last updated on a station - many of the stations are showing data from months or even years ago. Data is available in a tabular rather than graphical format and is difficult to interpret.
The manufacturer (GQ Electronics) sells some pretty good gear but I have to say that their monitoring network is almost worthless as far as Australia goes.
ANSTO have a monitoring station in Engadine, NSW (yes, the Sydney suburb famous for the most memorable achievement of Prime Minister Scott Morrison), to monitor the nearby Lucas Heights reactor. The actual nature of this monitoring station is unclear and it is not clear why it reads significantly lower than the others (about a third of what I'd expect); it is possible that it is sampling the atmosphere only and is shielded from cosmic rays.
They display their dose rate in nGy/h. Technically speaking this is a more correct thing to do, but it does make it more difficult to quickly compare with other sites. You can assume that 1000 nGy/h = 1 μSv/h, so their stated range of 30-60 nGy/h for local background translates to 0.03-0.06 μSv/h.
Annoyingly, they warn that " ''Spikes'' in the environmental radiation graph (above) may occur during the regular calibration checks (see below) of the instrument that are needed to ensure accurate data.". There is nothing to "see below" about when these calibration checks are performed, so it is not clear how you would determine whether a spike is real or not.
ARPANSA (The Australian Radiation Protection and Nuclear Safety Agency) promised in 2018 to have a real-time data from a monitoring network available on their web site by the end of the year. This appears not to have happened. You may want to visit their web site to check on the status of this project; I assume they will announce it on their front page when/if it finally happens.
There were at one stage monitoring sites in Western Australia and Nimbin Valley, but both have now been off-air for a while. I have included these links in case they come back to life, however I have been told that the person running the Nimbin Valley station has moved out of the area so this station is unlikely to ever be resurrected.
There was the "Kapiti gaigakaunta" monitoring station near Wellington, New Zealand. Although the website itself still exists, the link to the counter page returns a 404. Wayback Machine shows what it used to look like. Despite its name (I assume "gaigakaunta" is a phonetic rendering of "Geiger counter"), this site used a scintillation counter. The count rate of this counter was close to the combined rate of the tubes at the site here and should have a similar level of statistical error.
This station had the capability of measuring a gamma spectrum, which in principle allows different isotopes to be identified. Some spectra had been posted on the page, but they dated from 2011 and have now been removed.
Russia has ЕГАСМРО which stands for something like "Unified State Automated Monitoring System radiation situation in the territory of the Russian Federation". This site doesn't have any useful English translation available but the coloured dots on the map are fairly self-explanatory. This only covers Russia, but that spans a large portion of the Northern Hemisphere and is close enough to danger spots like North Korea and the Middle East to be useful.
They give dose rate in "мкР/ч", which translates to μR/h. Divide this by 100 to get μSv/h, i.e. if a place is indicating 15 мкР/ч, that means 0.15 μSv/h.
The United States EPA have Radnet which is confined to that country.
What limitations does this monitoring have?
There are no standards for radiation monitoring stations that I am aware of, except that they are often located 1 m above ground level. This station is somewhat lower than 1 m; this is due to physical limitations at the site, including the need to keep it out of direct sunlight as the SI-22G tubes have a relatively low temperature rating. The type and quantity of tubes is also probably unique (although I believe the site in WA mentioned above may have used a single SI-22G). This means that the readings at this site are not directly comparable to other sites.
There are some other limitations to this monitoring which it is worth mentioning:
Energy Compensation
Geiger tubes are over-sensitive to low energy gamma radiation. To clarify: "low energy", means that the gamma ray photons are individually of low energy (e.g. 50 keV rather than 500 keV) rather than that the overall dose rate is low. You can think of it like different radioisotopes emit different types of gamma rays, and that a Geiger tube can over-count some of these types.
The recognised way to fix this is to partially shield the tube with a substance that blocks the lower energy gamma rays. The best shielding material is apparently tin foil(!); but this has to be the actual metal tin—not kitchen-type aluminium foil—and it has to have a very specific thickness, which depends on the characteristics of the tube. Unfortunately, I don't have sufficient information to determine what thickness is required and foil of this type is difficult to obtain. Therefore I have not installed any energy compensation on these tubes.
Some would say that this means it's invalid to display a dose rate on this site. This is technically true, but may not be much of a problem in practice. The natural radioisotopes that produce the bulk of the background radiation have relatively high energy gamma rays and will be correctly accounted for. With fallout, it's more complicated because different things may be present depending on its origin and how old it is. Some of the more notorious components of fallout—iodine-131 and caesium-137—have high energy gamma rays, so will also be correctly accounted for (in fact, many Geiger tubes are calibrated with caesium-137). If there is a slight tendency to over-count due to low-energy gamma emitters like americium-241 (which is nasty stuff - basically it's like plutonium only without the bad press - and if there's enough of it around to affect readings you're in big trouble), I don't think that under the circumstances you should complain.
I display an estimated dose rate by default simply in order to have a figure that means something. Displaying a count rate (and I have provided this as an option for the purists) is more technically correct, but isn't very meaningful.
Alpha Radiation
Alpha radiation is not very penetrating and is easily blocked by most materials (including human skin). In order to detect it with a Geiger tube, it is necessary for this tube to incorporate a thin "alpha window" to allow the alpha particles into the interior of the tube. This alpha window is usually made from an extremely thin and fragile piece of mica, which renders the tube vulnerable to damage. I have heard that in some tubes it is thin enough to be punctured by a blade of grass, although I cannot vouch for this personally.
The expense and fragility of alpha-sensitive tubes are one reason I have not used them in this station.
A more important point, however, is that an alpha-sensitive tube will not give you a correct dose rate. With gamma (and to a lesser extent beta) radiation, what a Geiger tube measures is also what a person in the same vicinity would be exposed to, since this extremely penetrating radiation affects them both equally. With an alpha emitter, however, the tube only picks up radiation emitted within a couple of centimetres of its alpha window, whereas a human is only affected by the alpha emitters that they swallow or breath in. These two quantities will in most cases be very different.
Logically, you would need to quantify alpha emitters by concentration in the air (e.g. Bq/m3) and report this separately. Such monitoring is feasible (it's how radon detectors work) and I may set up such monitoring in future.
Dead-time compensation and fold-back
Geiger tubes suffer a phenomenon known as fold-back at high levels of radiation. In simple terms, the tube is pulsing so fast that often one pulse has not finished before the next starts. The electronics cannot detect this as a separate pulse and hence pulses are lost. This means that as the radiation level increases, the pulse rate of the tube increases less in proportion. Beyond a certain level, the pulse rate decreases as the radiation level increases, this is known as fold-back.
So we have two issues; the reduction in pulse rate as radiation level increases, which needs to be compensated for or it will lead to inaccuracy, and actual fold-back, which can't be compensated for and needs to be detected.
The former is known as "dead-time compensation"; because you are compensating for the time the tube is "dead" (i.e already producing a pulse and unable to produce another one). There is a standard formula used for dead-time compensation that gets bandied about on the web, however it turns out that this formula is a simplification and only works at low count rates. Apparently it only compensates for "non-paralyzable dead-time", whereas a Geiger tube has both paralyzable and non-paralyzable dead-time. Apparently, there is no analytical solution to compensating for paralyzable dead-time, so you have to solve it using iterative numerical methods. This is bad enough (although doable), but it also requires knowing tube parameters that can only be derived by complicated experiments that it's not possible for a private individual to perform.
My intent is to compensate based on a (somewhat dodgy) graph of count versus radiation level that appears to apply to this tube, probably using simple linear interpolation. At the time of writing this has not been done.
I have approached the fold-back problem by installing the SI-3BG tubes; at high rates we switch to using the SI-3BGs and ignore the SI-22Gs. Of course a SI-3BG will experience fold-back eventually, but at such a high level that it is highly unlikely that the rest of the system would still be working at that point.
Calibration
This is quite problematic. There is little data available on these
Geiger tubes, and some of it is misleading. A figure of 540
μR/count is often seen for the
There is also the separate can of worms involving converting R (Roentgens) to Sv (Sieverts), which, strictly speaking, can't be done precisely. And in addition, any Soviet era documents might be using the GOST definition of the Rontgen, which is about 5% different to that used by the West. I have used the conversion of 100 R = 1 Sv, which is (arguably) a horrible oversimplification, but one which is commonly used elsewhere.
In addition, regardless of the data-sheet values, the actual tubes vary in sensitivity by up to about 2% from each other.
The obvious solution in this case would be to calibrate the each tube against a known source or meter. The problem is that I have neither. Consumer-grade Geiger counters use low sensitivity tubes, so the statistical error can be significant even if the counter has been properly calibrated; and getting a counter which has a reasonable assurance of actually having been calibrated at all requires purchasing one of the more expensive types (> $1000).
As for obtaining a radioactive source, I have absolutely no desire to obtain such a thing. My problem is not with the radiation, but with the politics: the security forces in this country are not renown for their technical knowledge (and are led by a guy who is frankly a malicious idiot), and I can easily imagine that possession of even a tiny, harmless source might lead to some sort of extreme overreaction. As it is, I'm probably already on a list somewhere for purchasing the Geiger tubes.
So what I've done is to take the measurements made by Radu Motisan on his blog PocketMagic and use these to derive a conversion factor that is valid at background levels. This gives results which tally closely with the Caloundra monitoring station. Later, I will use the graphical data referred to above to extend this to higher levels.